


Offshore service stocks have been quiet
Yet business prospects continue to improve

Charts to Ponder

This chart shows the S&P 500's forward P/E as a starting point and the subsequent one-year return. You will note that the numbers are all over the place. Anything can happen in the short term (one year or less).
However, as the chart below shows, over a more extended period of time, say five years, the higher the starting P/E, the lower the returns.

The point is that the S&P's forward returns over the next five years are likely to be in the low single digits or lower at current valuations.
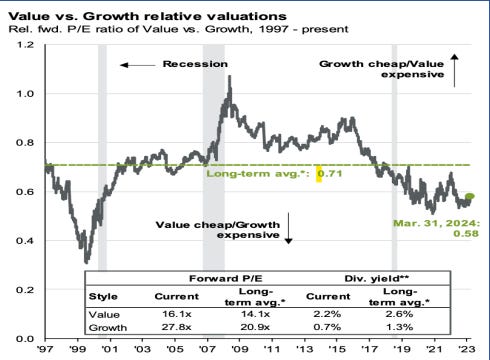
Value is cheap, and growth is overvalued
Offshore Oil
Schlumberger CEO says the offshore oil cycle is going to be higher for longer.
Tommy Deepwater Interviewed
Discusses (RIG) survivability. Nambian offshore prospects.
Oil demand continues to grow
Expect continued under-forecasting of oil demand growth by Western pundits.

Global growth to increase energy and metal demand


March saw a broadening and deepening of the upturn in global economic activity. Output expanded at the quickest pace since June 2023, with growth signalled across the six sub-sectors monitored by the survey and also in an increased number of nations.
March saw rates of expansion quicken in both the manufacturing and service sectors. Manufacturing production increased to the greatest extent for 21 months, with growth evenly distributed across the consumer, intermediate and investment goods industries.
Kuppy’s new gold stock is not a mining company
That is it for this week. Thanks for subscribing.
To your investing success,
John Polomny
If you like the information I provide in these emails, consider supporting me by buying me a cup of coffee. I am listener and reader-supported.
Are you interested in how I translate the information in these emails into actionable investment ideas?
Consider a subscription to my paid newsletter, “Actionable Intelligence Alert.” You can check it out by following the link below.
I'd like to pledge for the weekly stock pick but where do I?